Foresight for Food Systems Transformation | 2025
CHALLENGE
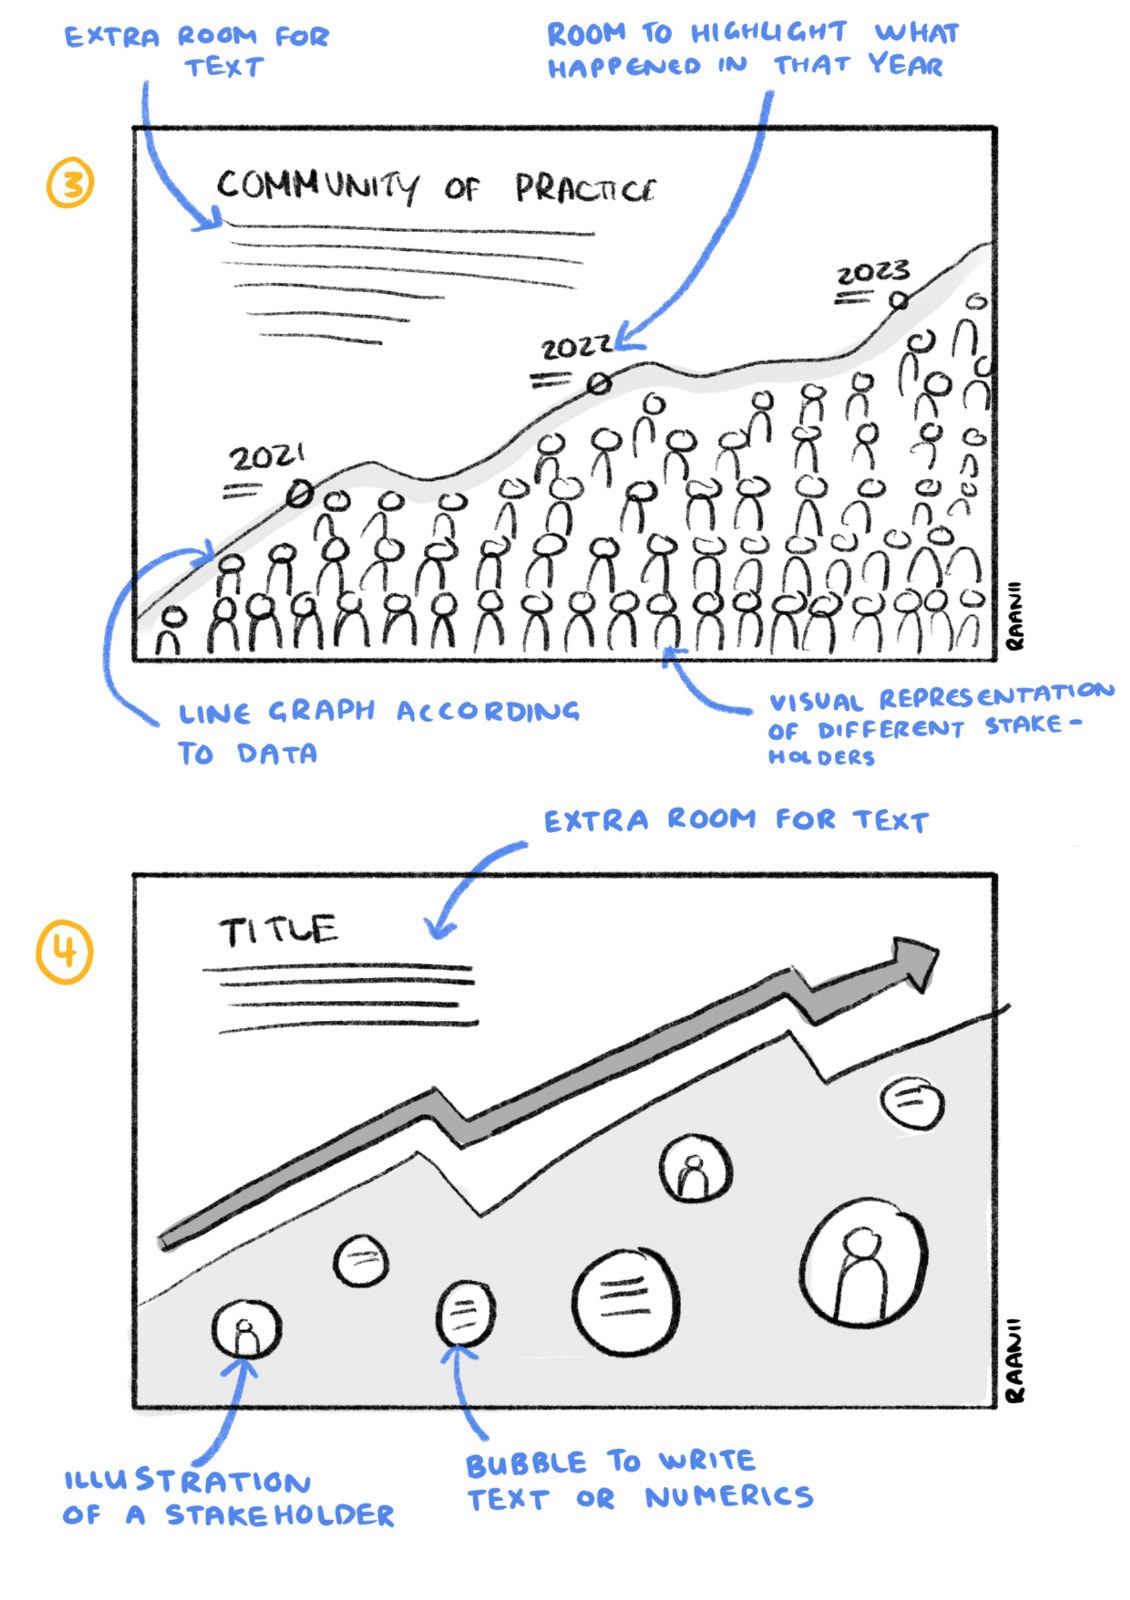
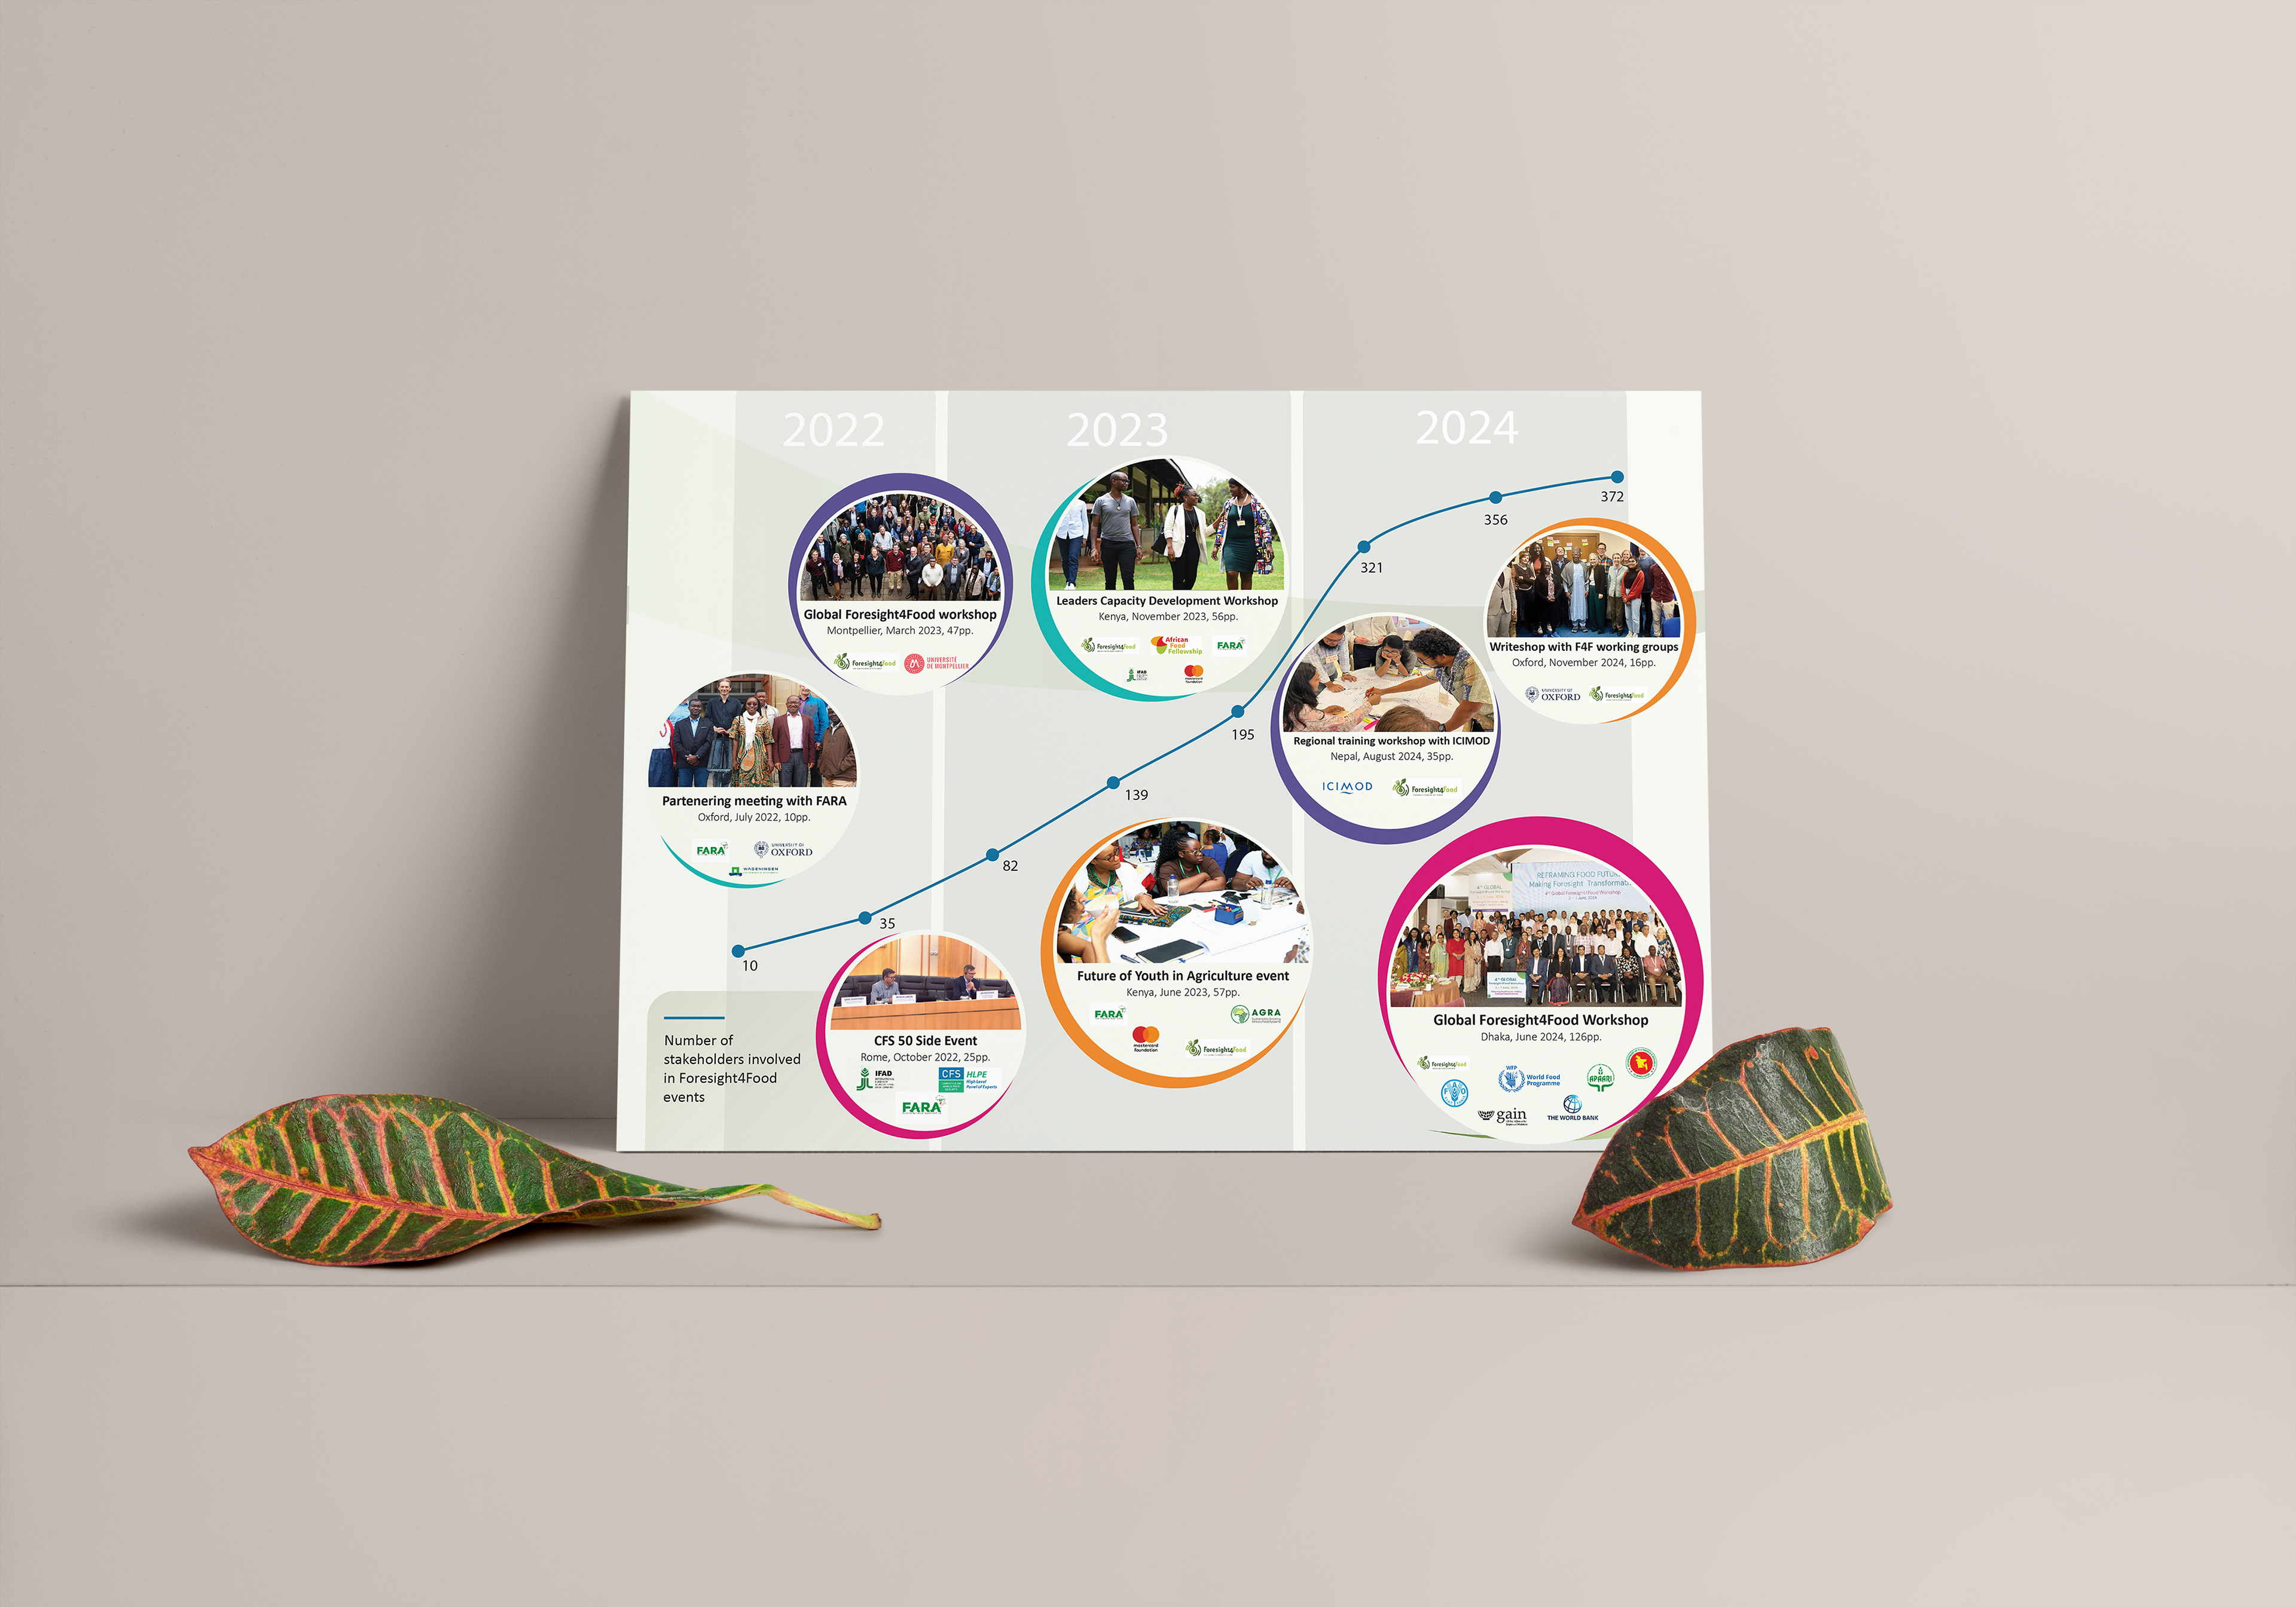
•Translate complex, multi-year data into engaging visuals that clearly communicate the programme’s impact.
•Ensure the infographics are accessible and understandable for diverse audiences, including potential clients and stakeholders.
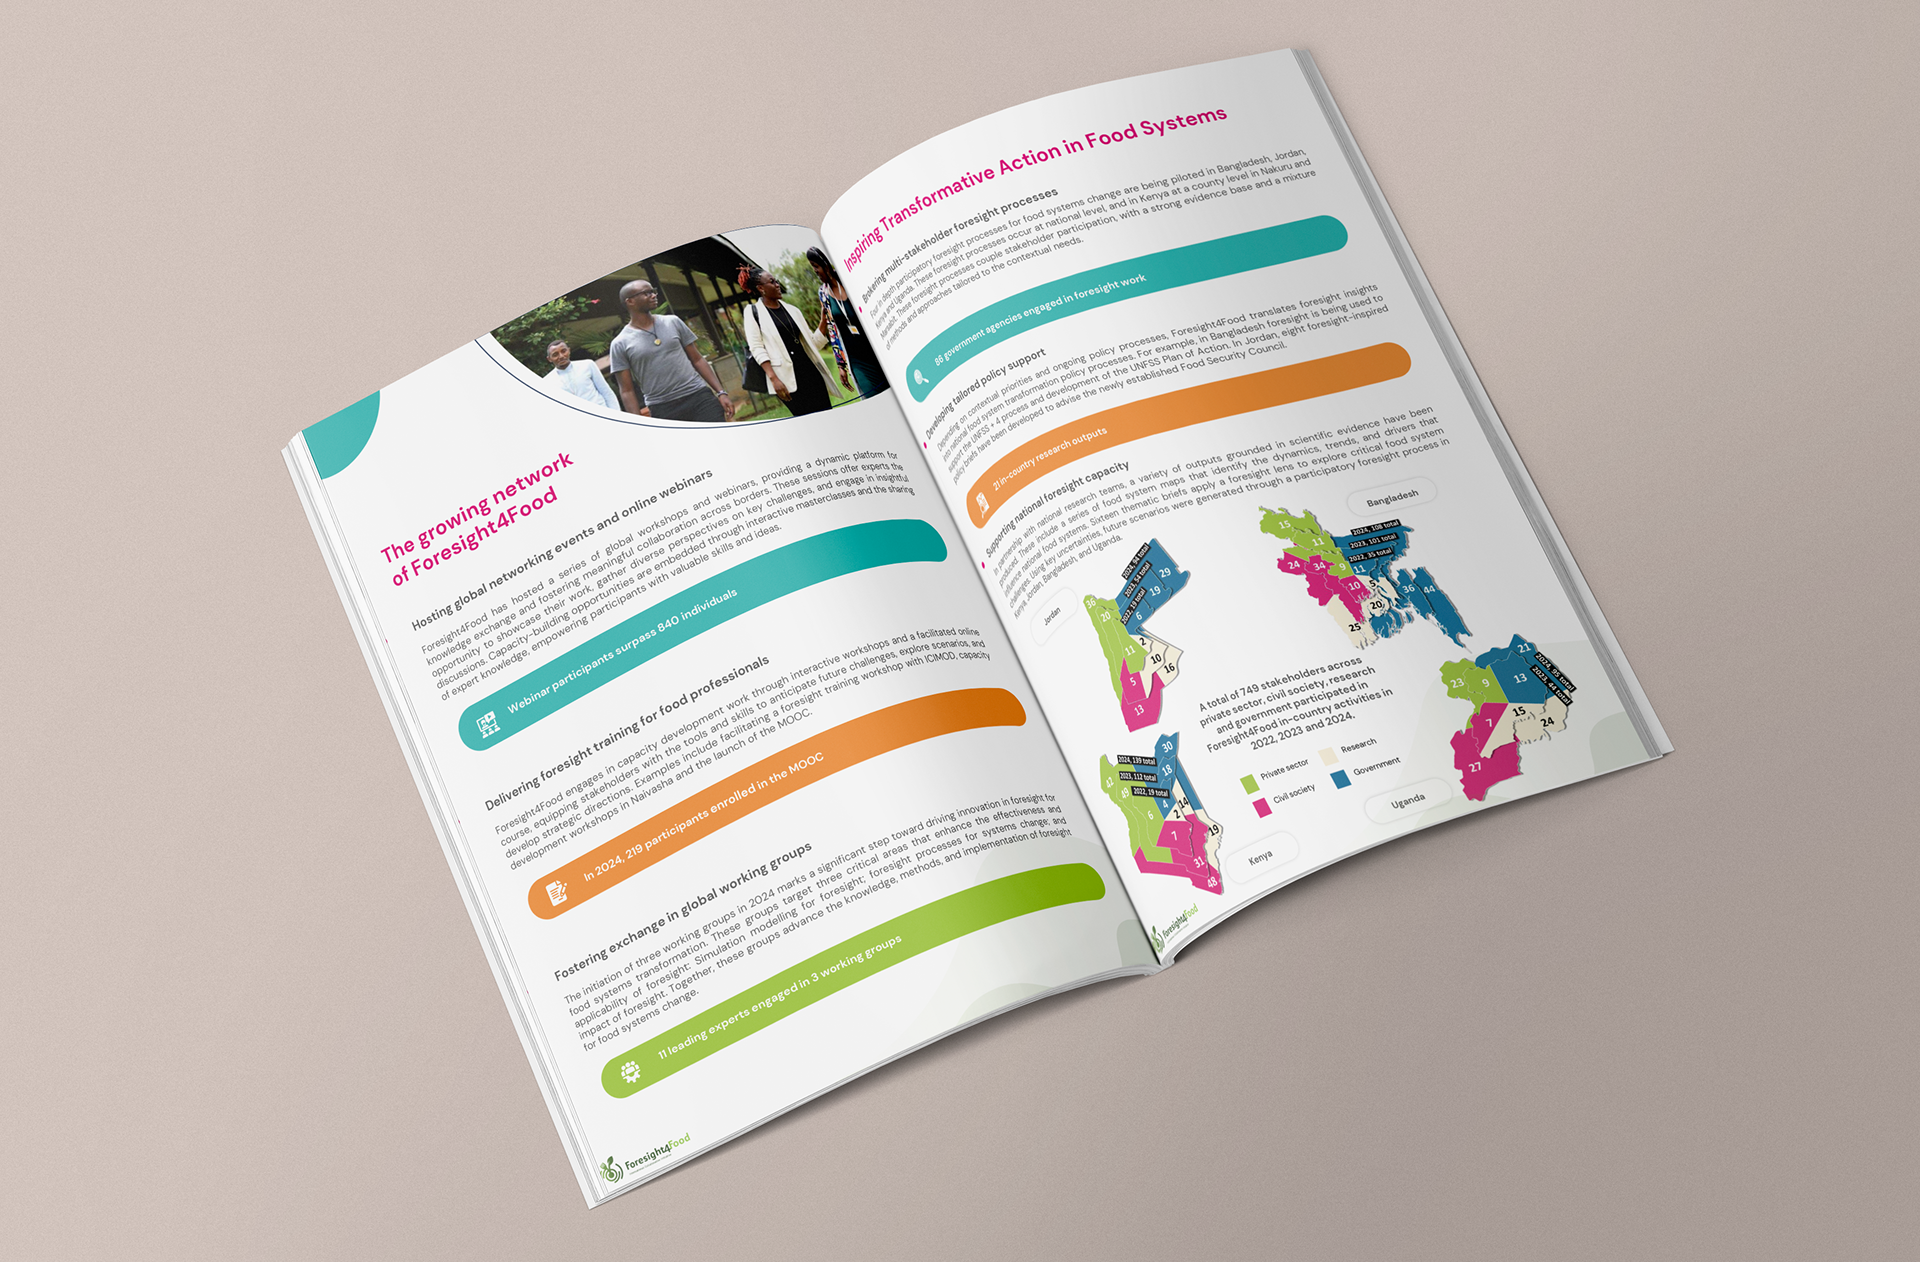
•Align the design with FoSTr’s existing branding and visual language.
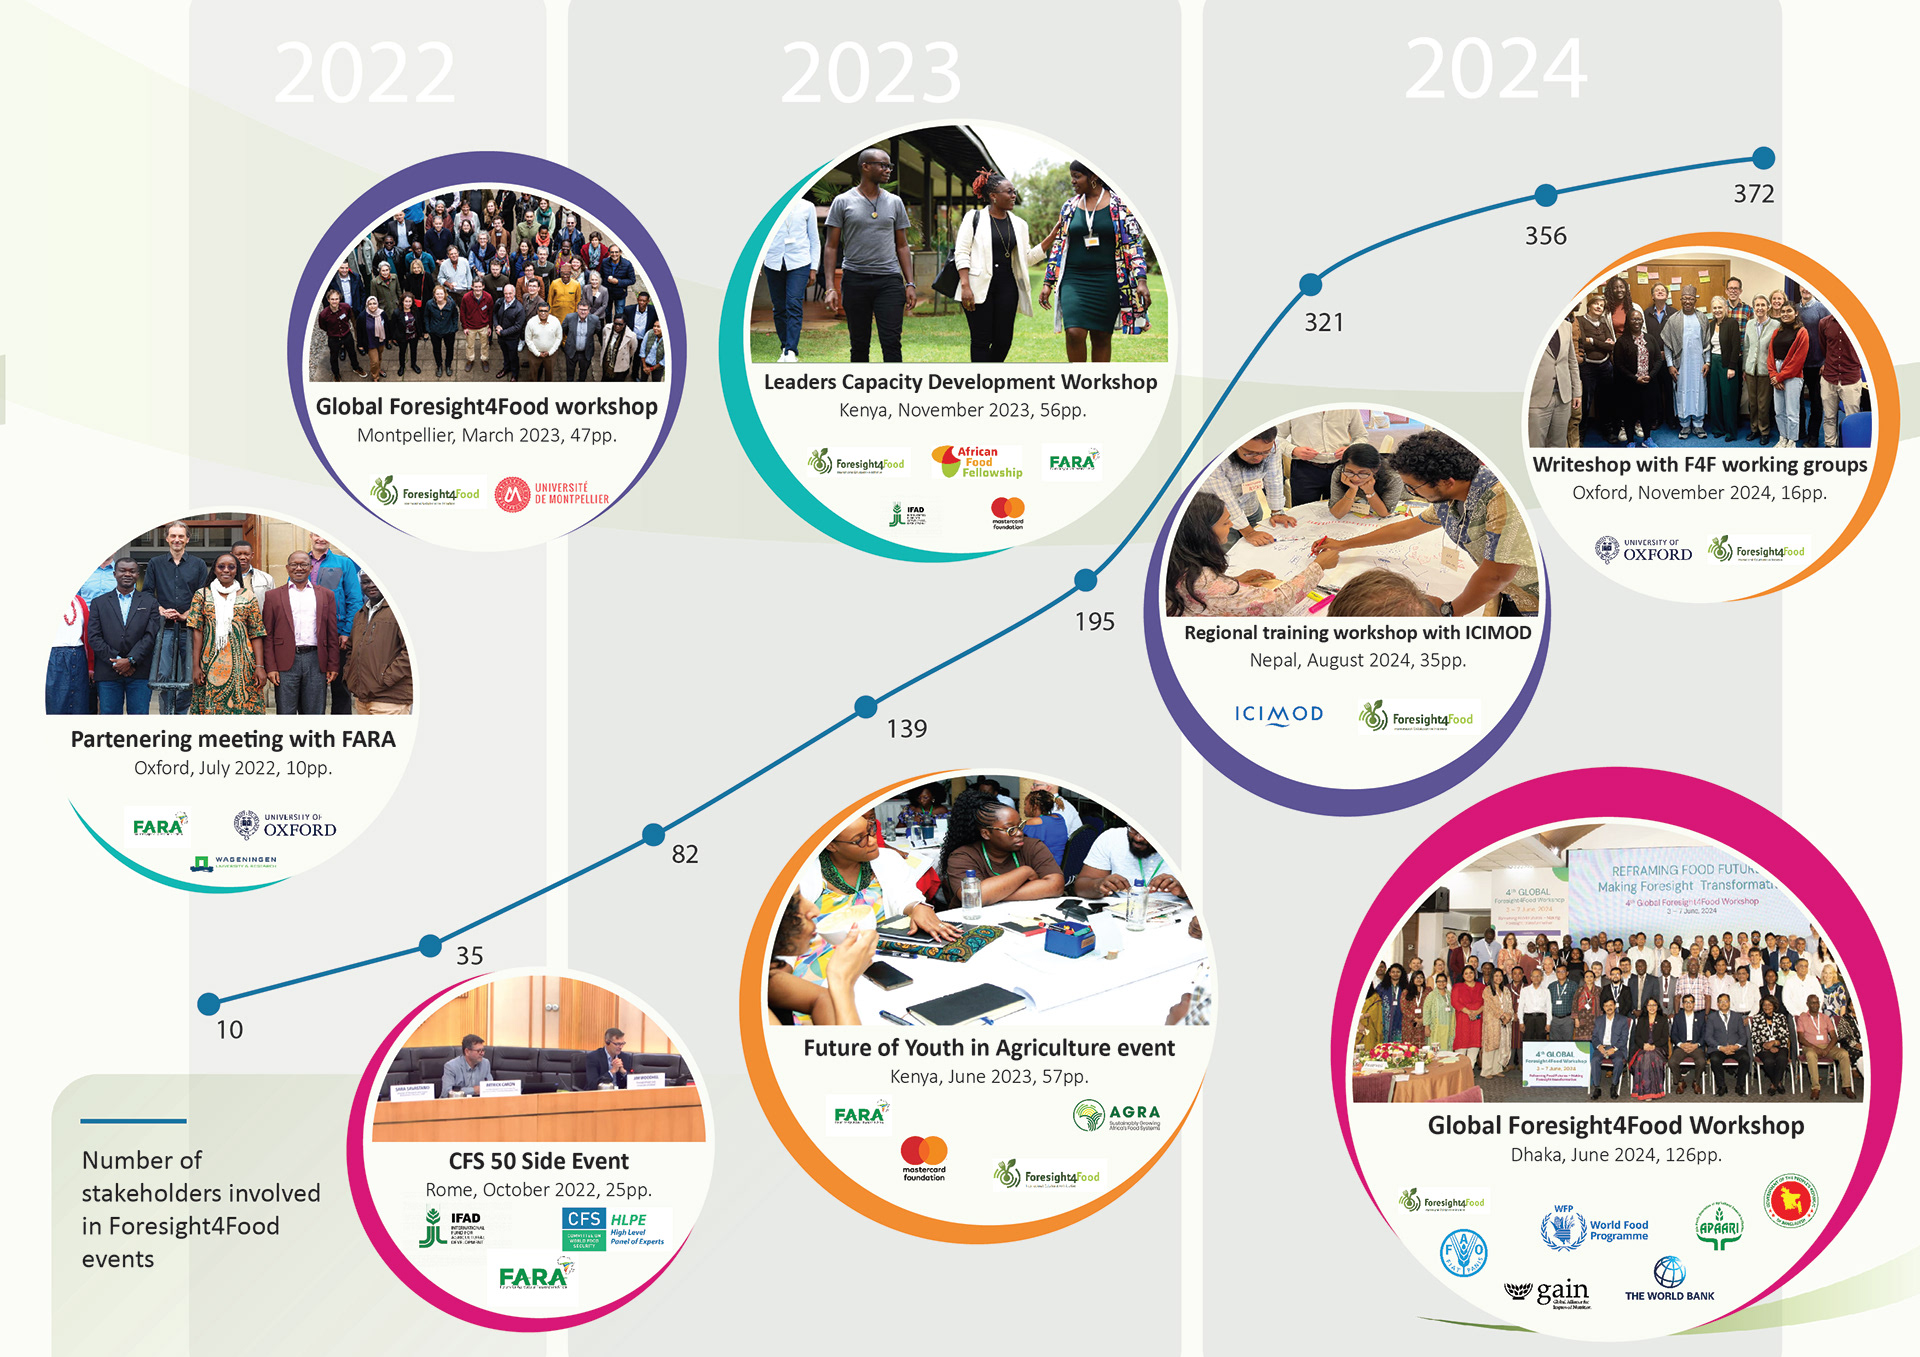
•Showcase both regional growth and event-based achievements in a format suitable for presentations and print.
SOLUTION
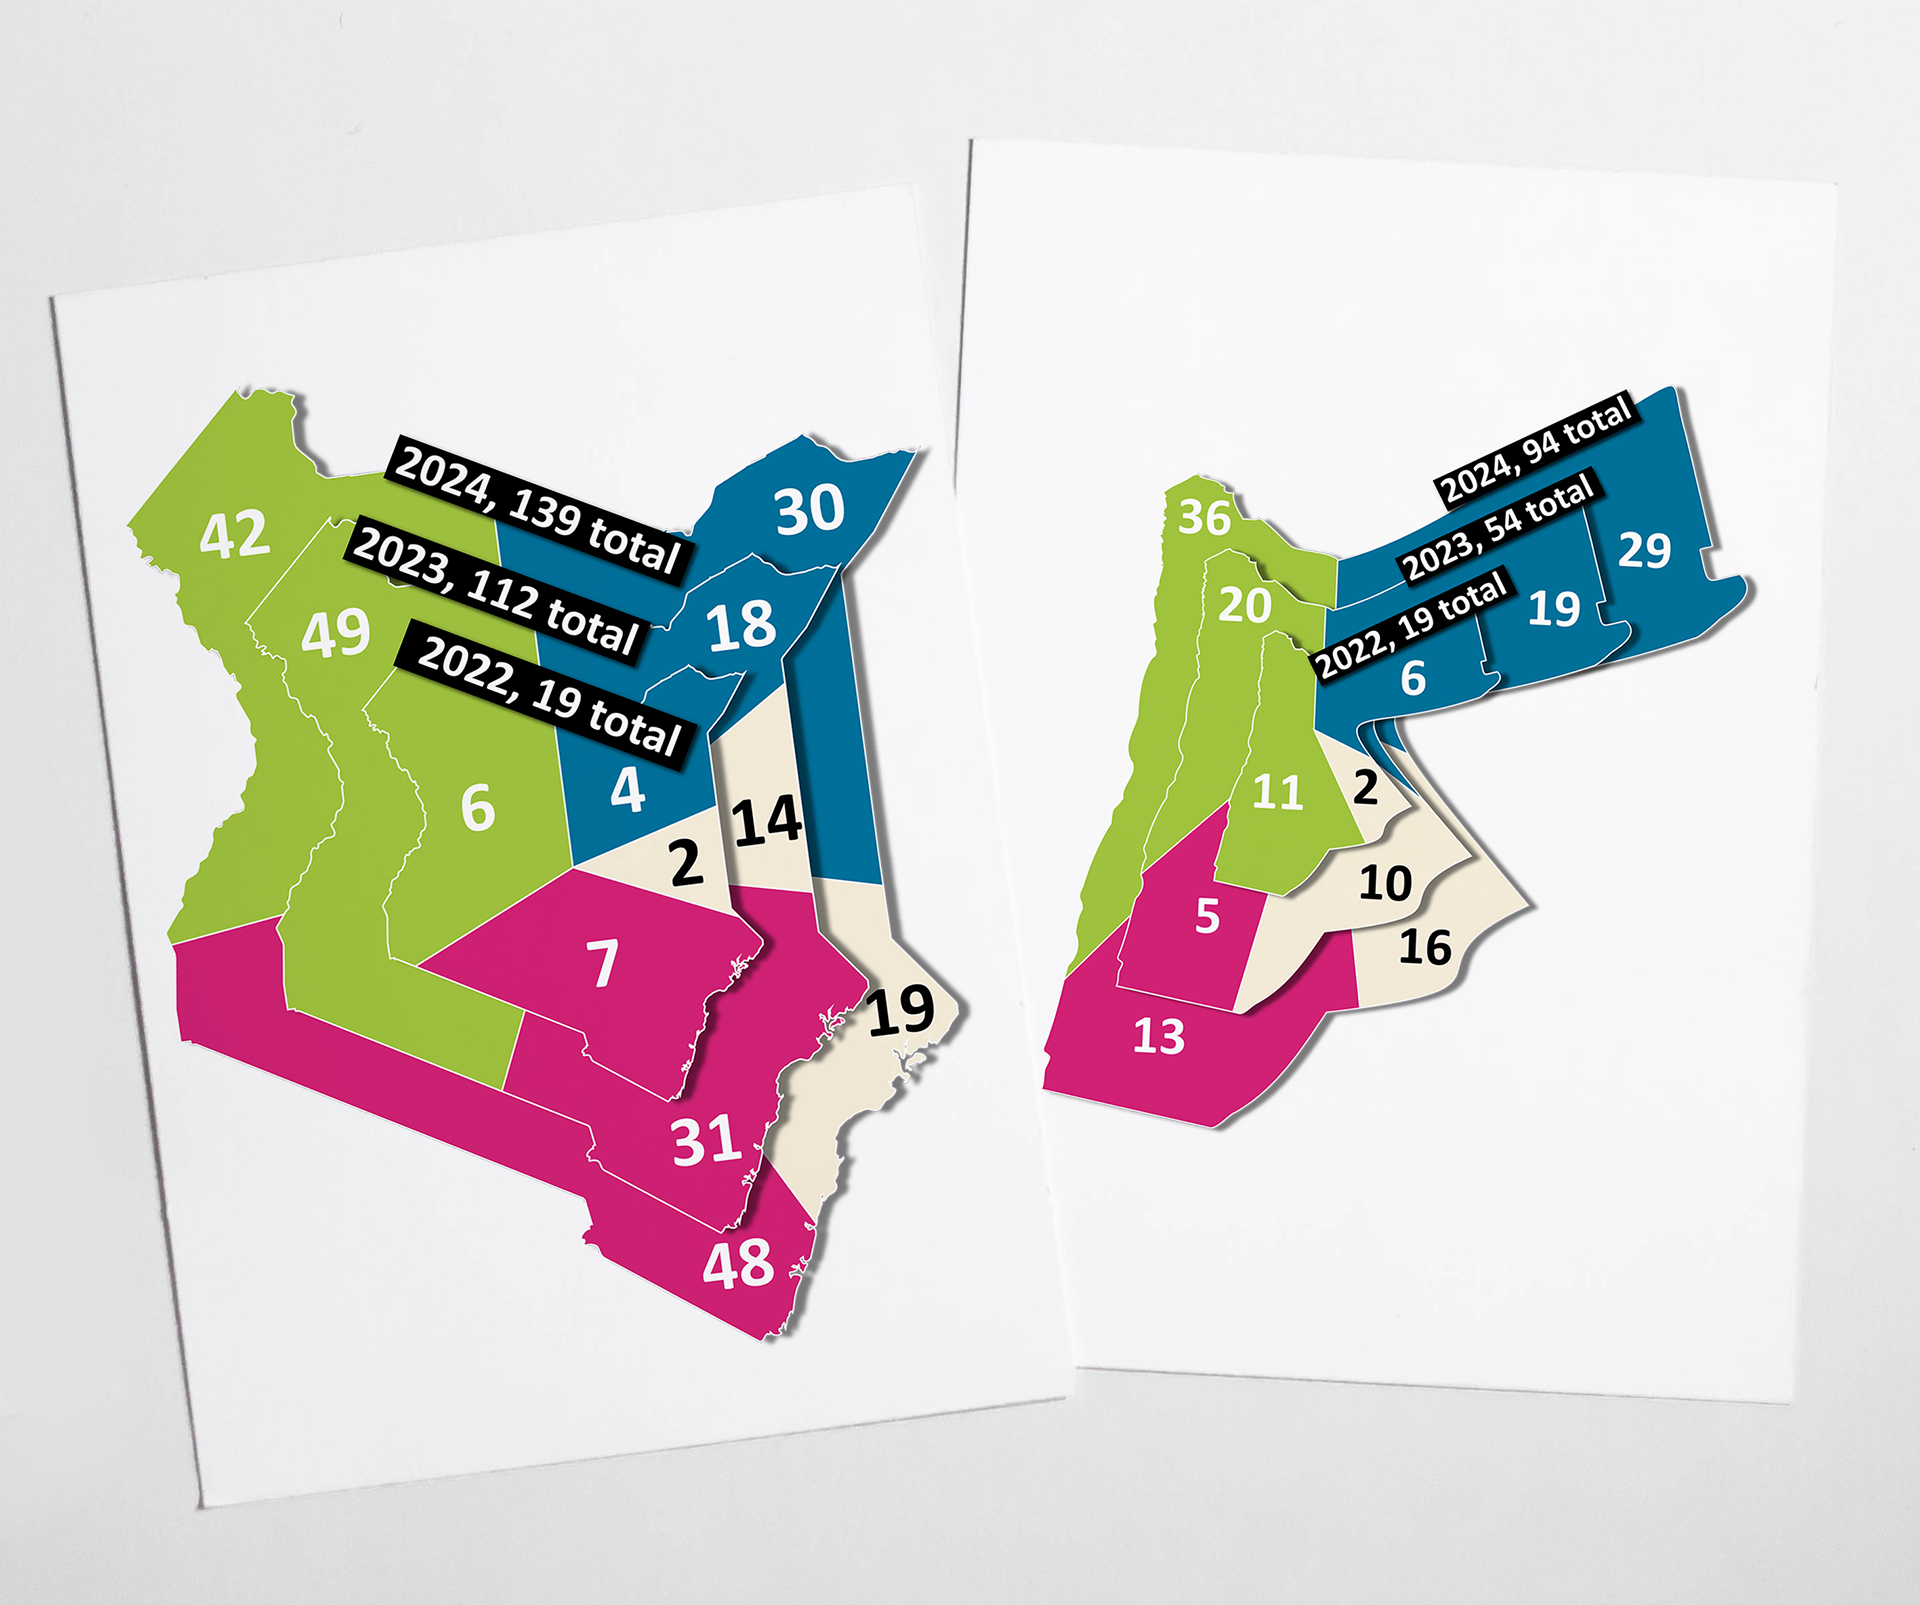
•Analyzed data to create clear, visually engaging country maps that highlight regional impact and growth.
•Designed an additional infographic summarizing key events, milestones, and achievements over the years.
•Maintained data accuracy while prioritizing clarity and readability through thoughtful layout and visual hierarchy.
•Collaborated closely with the client throughout the process to ensure alignment with their goals, producing tailored visuals for use in factsheets and stakeholder communication.
For more info on the FoSTr Programme see here.